Correlation data best portrays the continued close relationship among trend followers. Click here for more on the relationship.
More Correlation Charts
These are all sample snap shots. They are meant to illustrate the concept of correlation:
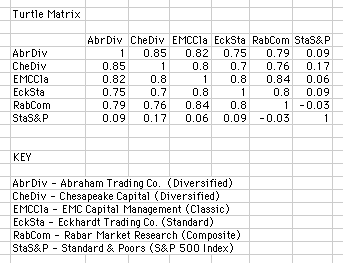
The above chart shows the correlation among Eckhardt, Chesapeake, Rabar and Abraham. One can readily see that their techniques are similar if not the same.
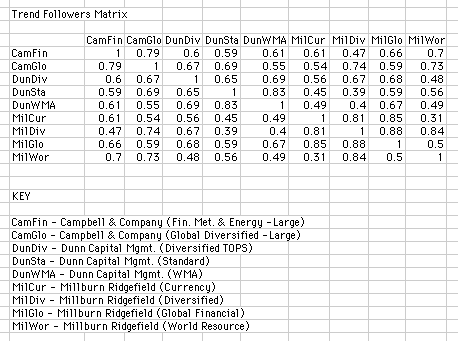
Dunn Capital, Millburn Ridgefield, Campbell and Company are trend followers that have been around each for over 20 years. The facts don’t lie.
What the Correlation Charts Show
The correlation among Eckhardt, Chesapeake, Rabar, and Abraham is not a coincidence of style. Eckhardt taught the Turtle rules. Parker applied them at Chesapeake. Rabar applied them independently. Abraham learned systematic trend following from secondary sources in Canadian, Texas with no direct Dennis or Eckhardt connection. The correlation of their monthly performance across extended periods is the empirical signature of managers who are capturing the same structural market dynamics through similar systematic rules, regardless of whether they trained together.
The second chart’s group, Dunn Capital, Millburn Ridgefield, and Campbell and Company, represents managers who developed systematic trend following approaches independently of the Turtle lineage. Dunn was founded in 1974. Millburn Ridgefield in 1971. Campbell and Company in 1972. All three predate the Turtle experiment by a decade. Their correlation with each other and with the Turtle-lineage managers in Chart #1 confirms that the approach’s performance signature emerges from the systematic response to price trends across global futures markets, not from the specific rules taught in a two-week Chicago training program in 1983.
Eckhardt’s observation that correlations tend to overstate the relationship among trend followers is the precise context for reading these charts correctly. The high correlation is partly a selection artifact: any manager who profits from trends will profit at the same times as other managers who profit from trends. But the charts also reveal that the underlying approach, follow sustained price trends across diversified global futures markets with defined entry, exit, and position sizing rules, produces a recognizable return signature regardless of the specific parameters each manager uses.
The practical implication for investors is that allocating to multiple trend following managers does not achieve the same diversification as allocating across genuinely uncorrelated strategies. The diversification benefit of trend following comes from its low correlation with equity markets and traditional asset classes, not from diversification among different trend following managers who are all capturing the same trends at the same time.
Frequently Asked Questions
Why are different trend following managers so highly correlated with each other?
Because they are all responding to the same price trends in the same markets at approximately the same times. When crude oil trends for six months, every trend following manager with a crude oil position captures that trend. When global equity markets trend down for a year, every trend following manager with short equity index positions captures that move. The correlation is the signature of an approach that responds to market-wide price dynamics rather than to manager-specific information or analysis.
What does the correlation among pre-Turtle managers like Dunn and Millburn prove?
That systematic trend following’s performance signature emerges from the approach itself rather than from the specific rules taught in the Turtle experiment. Dunn Capital, Millburn Ridgefield, and Campbell and Company all developed their approaches independently in the early 1970s, a decade before the Turtle training. Their correlation with Turtle-lineage managers confirms that the return profile comes from following price trends across diversified global futures markets, the structural feature all systematic trend followers share regardless of specific training or parameter choices.
Does high correlation mean all trend followers are doing exactly the same thing?
Not exactly. Different managers have different time horizons, market universes, entry and exit parameters, and position sizing approaches. These differences produce genuine variation in returns across managers, particularly during non-trending periods when the specific parameters matter more than the general approach. But at the level of which market conditions produce returns and which produce losses, the similarity is substantial because all are capturing the same structural phenomenon of sustained price trends.
Trend Following Systems
Want to learn more and start trading trend following systems? Start here.
