Volatility and risk are not the same thing.
Volatility is the up and down nature of markets. If your trading strategy expects the markets to move up and down, as markets often do, then you must be ready to deal with volatility specifically each and every day.
If you risk 2% of your original capital on a particular trade, that is a real risk of capital. Controlling risk is an absolute foundation of money management.
Nicole Meaden of TASS compared monthly standard deviations (volatility as measured from the mean) and semi-standard deviations (volatility measured on the downside only) and found that while trend followers experience a lot of volatility, it is concentrated on the upside, not the downside.
Meaden stated: “Trend followers cut their losses and let their profits run. I think the turtles are a classic case of a group of managers whose overall performance is unduly penalized by people looking too closely at the Sharpe Ratio”. The Sharpe ratio does not reveal whether volatility is on the plus or the minus side. Most turtles’ volatility is on the plus side or they would not be in business. The difference between the standard deviation and the semi-standard deviation is what counts. The actual formula for calculating them is identical, with one exception: the semi-standard deviation looks only at observations below the mean.
Meaden argues that if the semi-standard deviation is lower than the standard deviation, the historical pull away from the mean has to be on the plus side. If it is higher, it means the pull away from the mean is on the minus side. Comparing monthly standard and semi-standard deviation for trend followers we find the comparison showing 12.51 for the former, and 5.79 for the latter. Meaden believes this is a huge difference that puts most of trend following volatility on the upside.
Sources: Managed Derivatives Magazine
What the 12.51 vs. 5.79 Difference Actually Means
The numbers are worth unpacking. A standard deviation of 12.51 means that the typical monthly return for trend followers deviates from the mean by 12.51 percentage points in either direction. A semi-standard deviation of 5.79 means that the downside deviations from the mean average only 5.79 percentage points. The gap between the two tells you where the volatility is concentrated. If standard deviation and semi-standard deviation were equal, volatility would be symmetric: equally distributed above and below the mean. When the standard deviation is 12.51 and the semi-standard deviation is only 5.79, the math requires that the upside deviations are much larger than 12.51 to produce that gap. The volatility is asymmetric and concentrated on the upside.
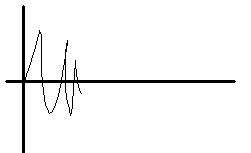
This is the structural description of a positively skewed return distribution. Trend following has frequent small losses and occasional large gains. The small losses do not deviate far from the mean. The large gains deviate substantially above it. Standard deviation penalizes both kinds of deviation equally, which is why the Sharpe ratio systematically undervalues trend following. A Sharpe ratio calculation treats a month with a large positive return the same as a month with a large negative return in terms of its contribution to the volatility measure. The investor who uses Sharpe ratio to compare a smooth mean-reversion strategy with a lumpy trend following strategy will consistently prefer the smoother strategy because it has lower standard deviation, even if both strategies have identical risk of permanent capital loss.
Meaden’s distinction between risk and volatility is the practical argument against using Sharpe ratio as the primary metric for evaluating trend following. Risk, defined correctly, is the probability and magnitude of permanent capital loss. Volatility is the variability of returns around the mean, which can be driven by large positive returns as easily as large negative ones. A strategy that is volatile because it occasionally captures 80% monthly returns is not more risky than a strategy that is smooth because its gains are small and consistent. It may be less risky if its downside volatility is low and its drawdowns are controlled by systematic risk management.
Frequently Asked Questions
What is the difference between risk and volatility in trading?
Risk is the probability and magnitude of permanent capital loss. Volatility is the variability of returns around the mean, which can be driven by large positive returns, large negative returns, or both. The two are not the same. A strategy with high volatility concentrated on the upside is not more risky than a low-volatility strategy if its downside deviations are small and controlled. Confusing volatility with risk causes investors to penalize trend following for its large positive returns.
Why does the Sharpe ratio undervalue trend following?
Because the Sharpe ratio treats upside volatility and downside volatility as equivalent contributors to total risk. A month with a 50% gain is penalized the same as a month with a 50% loss in a Sharpe ratio calculation. Trend following’s large upside months drive up the standard deviation measure, which reduces the Sharpe ratio, even though those months represent gains rather than losses. The semi-Sortino or downside deviation measures correct for this by measuring only the downside component of volatility.
What does a semi-standard deviation of 5.79 vs. standard deviation of 12.51 mean?
It means the downside volatility (5.79) is less than half the total volatility (12.51). The difference between the two must be accounted for by upside deviations substantially larger than the mean. The return distribution is positively skewed: most months produce small losses or small gains, and occasional months produce very large gains. This is the statistical signature of a strategy that cuts losses short and lets profits run — exactly the description of systematic trend following.
Trend Following Systems
Want to learn more and start trading trend following systems? Start here.
