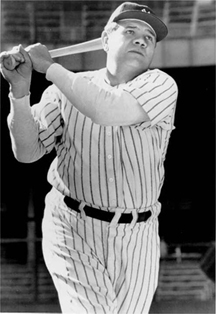
The Babe Ruth Effect:
Frequency versus Magnitude
![]() Download the Adobe .pdf report.
Download the Adobe .pdf report.

Michael Mauboussin offers clarity on trading frequency versus magnitude. It is a must read for all traders, especially those interested in high frequency trading strategies. Download the white paper above the picture.
The below is an excerpt from the complete Turtle Trader: Know your Edge – enjoy.
“What can you expect to earn on each trade on average over the long run from your investing decisions or your trading rules?” Or, as a blackjack player would say, “What is your edge?” A first step for the Turtles was to know their edge.
A good analogy is being a batter at the plate in a baseball game, as trades and success rates aren’t much different from batters and their averages. Dennis expanded on this: “The average batter hits maybe .280 and the average system might be successful 35 percent of the time.”
More importantly what kind of hits did you get in hitting .280. Did you hit singles or home runs? In trading, the higher the expectation, the more you can earn. A trading system with an expectation of $250 per trade will make you more money than a system with a $100 per trade expectation (all other things being equal in the long run).
The Turtle rules and regulations themselves had a positive expectation per trade because their winning trades were many multiples larger than their losing trades. Expectation (or edge, or expected value) is calculated with a straightforward formula:
E (PW AW) (PL AL) Where:
E Expectation or Edge PW Winning Percent AW Average Winner PL Losing Percent
AL Average Loser
For example, assume a trading system has 50 percent winning trades. Now, assume the average winning trade is $500 and the average losing trade is $350. What is the “edge” for that trading system?
TurtleTrader_3p_new_PitFF.pdf October 14, 2008 11:48:07 86
Edge (PW AW) (PL AL)
Edge (.50 500) (.50 350)
Edge 250 175
Edge $75 on average per gain per trade
Over time you would expect to earn $75 for each trade placed. For comparison, another trading system might be only 40 percent accu- rate with an average winner of $1,000 and an average loser of $350.How would that system compare to the first one?
E (PW AW) (PL AL)
E (.40 1,000) (.60 350)
E 400 210
E $190 on average per gain per trade
The second trading system’s “edge” is 2.5 times that of the first even though it has a much lower winning percent. In fact, the second system breaks even with a winning percent of 25.9. The first system breaks even at 41.1 percent. Clearly, when you hear the media and talking heads talking about “90 percent winning trades,” that talk is misleading. Percent accuracy means nothing.
Look at it this way. Think about Las Vegas. A small edge keeps casi- nos in business. That’s how those monster hotels in Las Vegas and Macau are paid for—by exploiting the edges. Dennis always wanted his trading to resemble being the house.It didn’t necessarily matter how little the Turtles lost on any individ- ual trade, but they needed to know how much they could lose in their whole portfolio. Eckhardt was clear: “The important thing is to limit portfolio risk. The trades will take care of themselves.”5
You need to calculate your edge for every trading decision you make, because you can’t make “bets” if you don’t know your edge. It’s not about the frequency of how correct you are; it’s about the magnitude of how correct you are.
Trend Following Products
Review trend following systems and training:

More info here.
