![]()
![]() Download the Adobe .pdf report.
Download the Adobe .pdf report.
Michael Mauboussin offers clarity on trading frequency versus magnitude. It is a must read for all traders, especially those interested in high frequency trading strategies. Download the white paper above the picture.
The below is an excerpt from the complete Turtle Trader: Know your Edge — enjoy.
“What can you expect to earn on each trade on average over the long run from your investing decisions or your trading rules?” Or, as a blackjack player would say, “What is your edge?” A first step for the Turtles was to know their edge.
A good analogy is being a batter at the plate in a baseball game, as trades and success rates aren’t much different from batters and their averages. Dennis expanded on this: “The average batter hits maybe .280 and the average system might be successful 35 percent of the time.”
More importantly what kind of hits did you get in hitting .280. Did you hit singles or home runs? In trading, the higher the expectation, the more you can earn. A trading system with an expectation of $250 per trade will make you more money than a system with a $100 per trade expectation (all other things being equal in the long run).
The Turtle rules and regulations themselves had a positive expectation per trade because their winning trades were many multiples larger than their losing trades. Expectation (or edge, or expected value) is calculated with a straightforward formula:
E = (PW × AW) − (PL × AL)
Where:
E = Expectation or Edge
PW = Winning Percent
AW = Average Winner
PL = Losing Percent
AL = Average LoserFor example, assume a trading system has 50 percent winning trades. Now, assume the average winning trade is $500 and the average losing trade is $350. What is the “edge” for that trading system?
Edge = (PW × AW) − (PL × AL)
Edge = (.50 × 500) − (.50 × 350)
Edge = 250 − 175
Edge = $75 on average per gain per tradeOver time you would expect to earn $75 for each trade placed. For comparison, another trading system might be only 40 percent accurate with an average winner of $1,000 and an average loser of $350.
How would that system compare to the first one?
E = (PW × AW) − (PL × AL)
E = (.40 × 1,000) − (.60 × 350)
E = 400 − 210
E = $190 on average per gain per tradeThe second trading system’s “edge” is 2.5 times that of the first even though it has a much lower winning percent. In fact, the second system breaks even with a winning percent of 25.9. The first system breaks even at 41.1 percent. Clearly, when you hear the media and talking heads talking about “90 percent winning trades,” that talk is misleading. Percent accuracy means nothing.
Look at it this way. Think about Las Vegas. A small edge keeps casinos in business. That’s how those monster hotels in Las Vegas and Macau are paid for — by exploiting the edges. Dennis always wanted his trading to resemble being the house.
It didn’t necessarily matter how little the Turtles lost on any individual trade, but they needed to know how much they could lose in their whole portfolio. Eckhardt was clear: “The important thing is to limit portfolio risk. The trades will take care of themselves.”
You need to calculate your edge for every trading decision you make, because you can’t make “bets” if you don’t know your edge. It’s not about the frequency of how correct you are; it’s about the magnitude of how correct you are.
Why This Is the Most Important Concept in Trading
The expectation formula makes explicit what the media’s obsession with win rates obscures. A system that wins 90% of the time is not necessarily profitable. A system that wins 35% of the time is not necessarily losing. The only number that determines profitability over a large sample is the edge per trade, which combines both win rate and average win/loss ratio in a single calculation. A system with a $190 edge per trade at 40% accuracy will compound faster than a system with a $75 edge at 50% accuracy. The 50% system “feels” better because it wins more often. The 40% system produces better outcomes because it wins bigger when it wins.
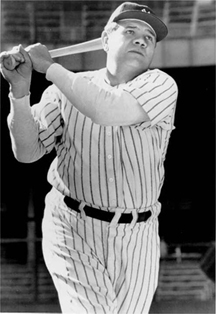
Mauboussin’s Babe Ruth analogy is perfect. Ruth was not a .300 hitter. He struck out more often than almost anyone. But when he connected, the ball left the park. His magnitude of success dwarfed his frequency of failure. A trend following system operates on the same principle. Most entries fail to develop into large trends. The frequent small losses are the Ruth strikeouts. The occasional large winning trend is the home run. The system’s edge comes from making the home runs large enough to more than offset all the strikeouts. This is why cutting losses short and letting profits run is not just a trading cliché. It is the mathematical requirement for producing a positive-expectation system with a low win rate.
Eckhardt’s observation that the important thing is to limit portfolio risk and the trades will take care of themselves follows directly from the edge formula. If the edge per trade is positive and the position sizing limits the maximum loss on any one trade to a defined fraction of equity, the portfolio will grow over a sufficient number of trades. The individual trade’s outcome is irrelevant. The edge, applied consistently across hundreds of trades, produces the result. This is what Dennis meant when he compared his desired trading to being the house in a casino. The house does not win every hand. The house wins because it has an edge on every hand, consistently applied at defined bet sizes across a very large number of hands.
Frequently Asked Questions
What is the Babe Ruth Effect in trading?
It is the principle that the magnitude of success matters more than the frequency of success. Ruth struck out frequently but hit enormous home runs when he connected. A trend following system loses on most trades but produces large gains on the minority that develop into sustained trends. The overall edge comes from the size of the wins relative to the losses, not from winning most of the time.
How do you calculate the edge of a trading system?
Edge = (Winning % × Average Winner) minus (Losing % × Average Loser). A system that wins 40% of the time with average winners of $1,000 and average losers of $350 produces an edge of $190 per trade. A system winning 50% with $500 average winners and $350 average losers produces only $75. The 40% system has a 2.5 times larger edge despite winning less often.
Why does percent accuracy mean nothing by itself?
Because profitability depends on the combination of win rate and payoff ratio. A system winning 90% of the time can still be unprofitable if the 10% of losses are large enough to exceed the cumulative small gains. A system winning 25% can be highly profitable if the winners are many multiples larger than the losers. The edge formula correctly combines both inputs into a single number that tells you what the system will produce over a large sample.
What did Eckhardt mean by “limit portfolio risk and the trades will take care of themselves”?
That the individual trade’s outcome is not the primary concern. If the edge per trade is positive and the position sizing limits each trade’s maximum loss to a defined fraction of equity, the portfolio will grow over a sufficient number of trades. The trader’s job is to maintain correct position sizing and follow the rules consistently. The edge, compounded across hundreds of correctly sized trades, produces the result without requiring the trader to manage individual outcomes.
Trend Following Systems
Want to learn more and start trading trend following systems? Start here.
